A project documentation is a comprehensive report that outlines the work done in a data visualization project. It serves as a reference for others, detailing the project’s title, contributors, objectives, and methods. Typically structured as a README.md file, it includes links to online resources, a project abstract, an introduction with goals and audience, details on data sources and preprocessing, descriptions of visualizations, key findings, and potential future steps. This document ensures clarity, replicability, and accessibility for the project's audience.
Our research explores crime distribution in Boston, focusing on identifying safer areas and optimal times to explore the city. By analyzing crime trends and their spatial-temporal patterns, we provide insights into areas and times to avoid, offering valuable guidance for residents, tourists, and potential movers to make informed safety decisions.
Villani Giacomo, Bernacchia Alessia, Pioda Tommaso
2024-2025
This project explores the distribution and severity of crimes across Boston's various districts, providing valuable insights for residents and visitors. By analyzing crime data collected over the past four years, we identify key patterns in criminal activity, including the most critical times and areas for safety.
Our findings reveal that the most critical time for safety in Boston is around 5 PM, when crime rates peak. Districts such as Roxbury (B2), Dorchester (C11), and South End (D4) are identified as the most problematic, with higher concentrations of serious and medium-level crimes. In contrast, Charlestown (A15) emerges as a model of safety and stability, thanks to its active community, historical landmarks that enhance surveillance, and successful urban redevelopment efforts.
Despite the higher crime rates in certain districts, all areas of Boston offer unique cultural and historical attractions that should not be overlooked. For those seeking a peaceful and secure environment, Charlestown stands out as an ideal destination, embodying a perfect blend of safety and charm.
This project underscores the importance of understanding crime patterns to navigate the city more safely and highlights the potential for positive change through community engagement and urban development.
Our research focuses on the distribution of crimes in Boston, aiming to identify the safest areas and the best times to explore the city. While pinpointing precise answers to these questions is challenging, we concentrated on illustrating crime trends and their spatial and temporal distribution. This approach provides a clear overview of the areas and times to avoid. The main questions driving our research were aimed at understanding which parts of Boston are more prone to criminal activity. To achieve this, we analyzed a dataset containing information about crimes, including the type of crime, the day and time it occurred, and its geographic location. This study is particularly valuable for residents of Boston, tourists, and individuals considering moving to the city. It serves as a practical guide to better understand the patterns of crime in Boston and make informed decisions about safety.
For data sources and protocol informationgo to the page dedicated:
protocol pageData visualizations and visual encoding transform raw data into graphical formats, such as charts or maps, to communicate insights effectively. Visual encoding involves mapping data attributes (e.g., values, categories) to visual elements like position, color, size, or shape for clear interpretation.
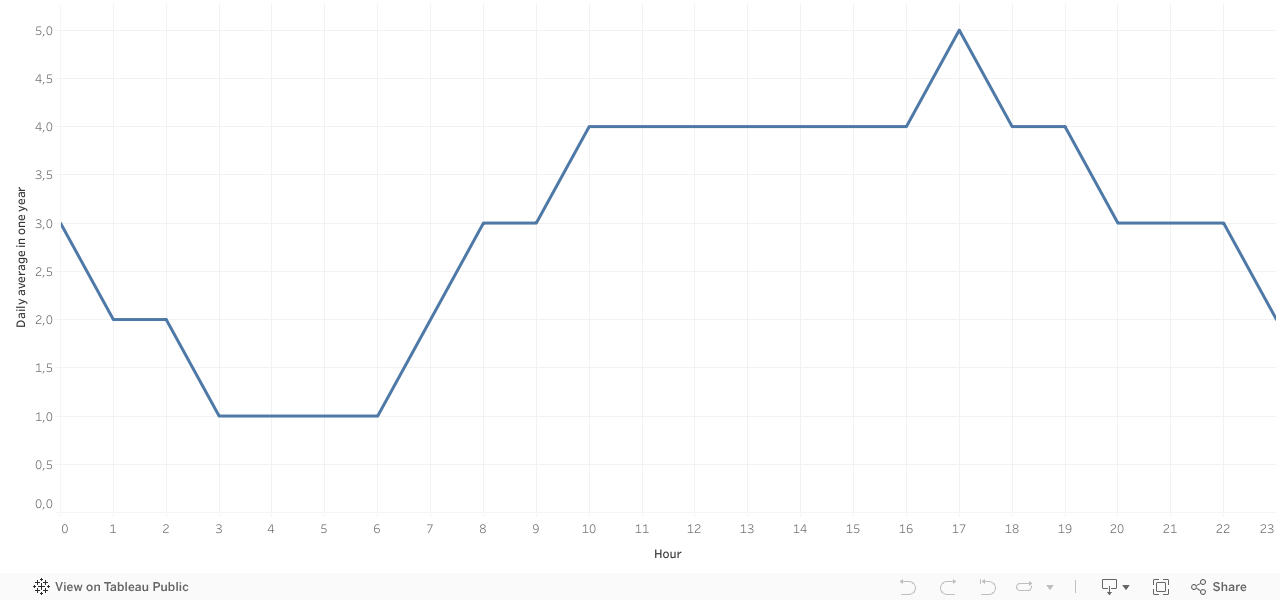
This graph shows us the average trend in the number of crimes in Boston during the day.
On the X-axis we have the hour of the day, while on the Y-axis we have the number of crimes committed in Boston.
This graph is the result of a daily average over the 4 years of data we had available.
As you can tell, the most dangerous time of day is around 5:00 p.m., while the quietest time is during the night from 03:00 to 06:00 in the morning.
These maps illustrate how crimes are distributed across Boston, categorized by their level of severity. They provide a valuable visual representation of which police districts experience higher crime rates. The crimes are divided into three levels of severity: Low severity (UCR Part 03), Medium severity (UCR Part 02), High severity (UCR Part 01), While the Boston Police Department typically classifies crimes only as UCR Part 01 and UCR Part 02, we introduced a third category (UCR Part 03) to include very low-level crimes, ensuring a more detailed representation of crime types. In these maps, greater saturation indicates a higher number of crimes recorded in a particular district over the four years covered by our data.
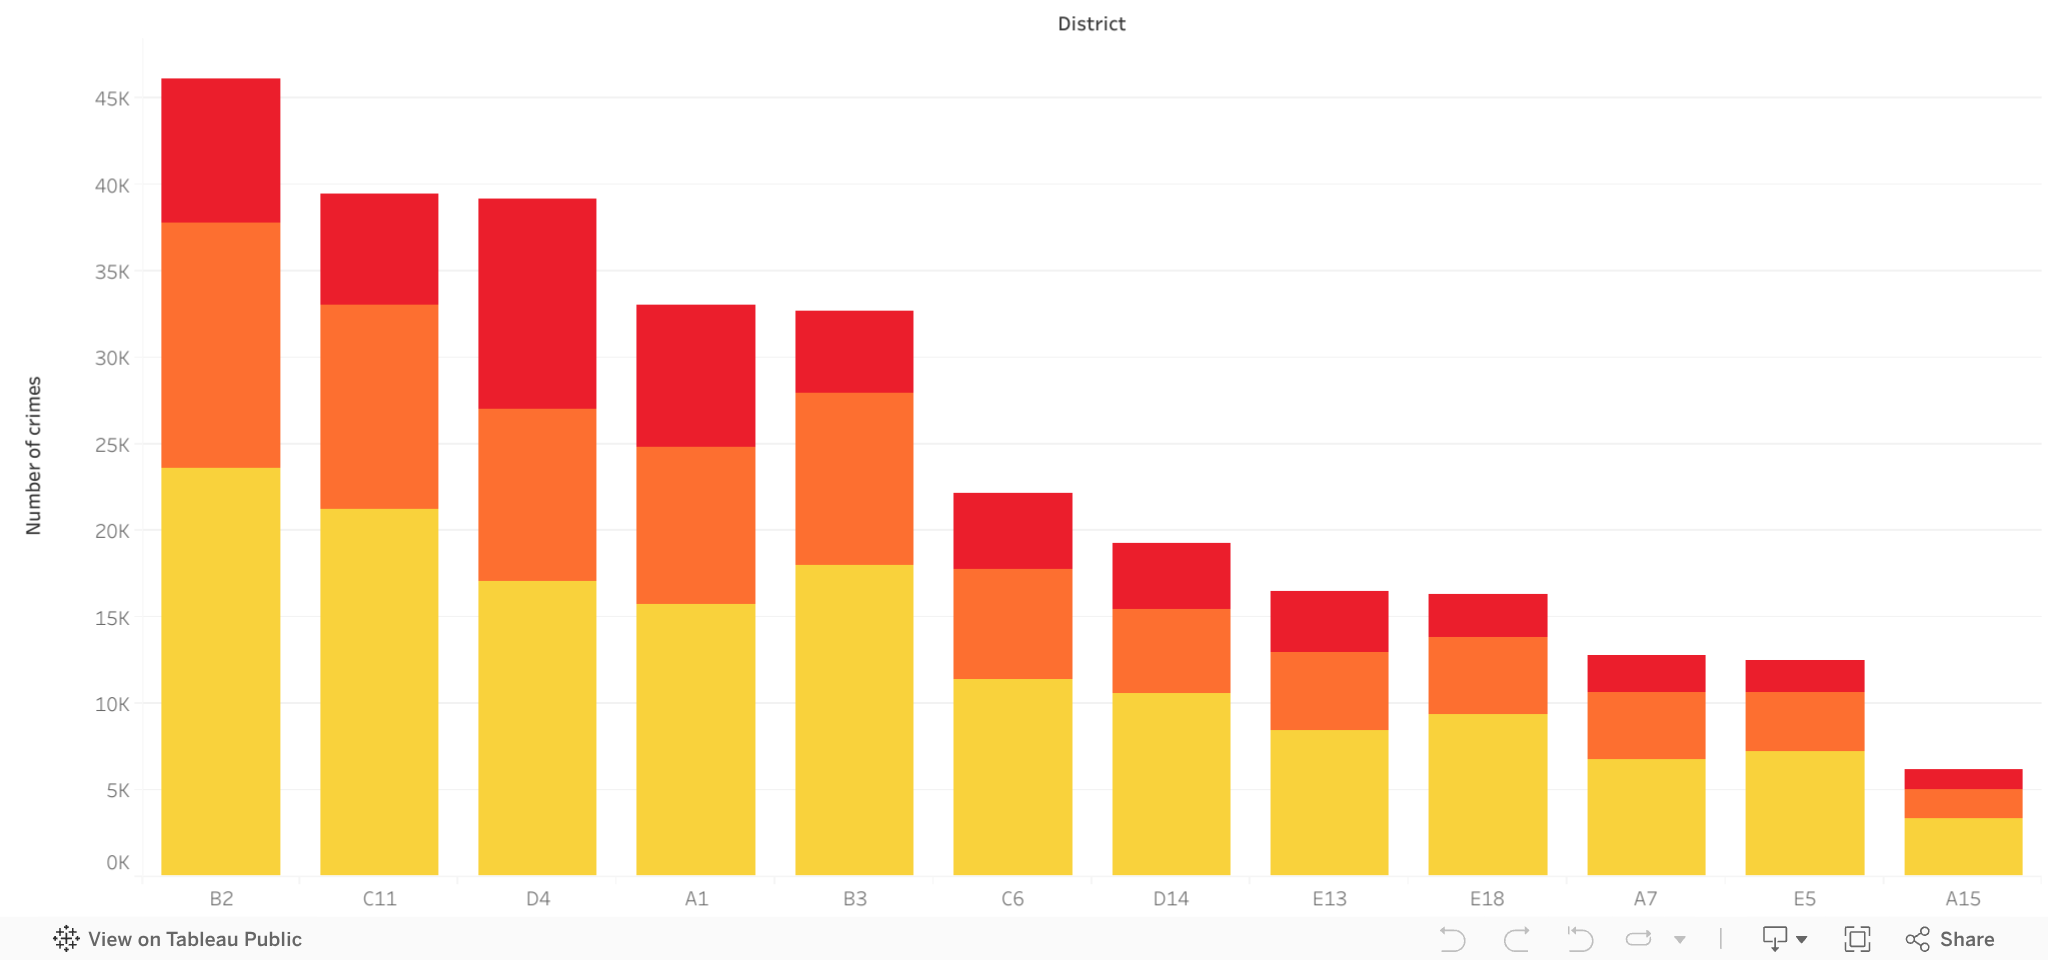
The bar plot illustrates the number of crimes committed in each police district over a four-year period.
This visualization is particularly useful for understanding the total number of crimes recorded in Boston during these four years. From the data, it is evident that most of the crimes fall under the UCR Part 03 category, which represents low-severity offenses.
The police districs with the highest number of crimes are: B2, C11, D4 while the lowest one is A15. Is important to notice that the police districts with the higest number of crimes are the one nearer to the city center while the ones further away are the ones with a lower level of criminality. This could suggest us that the crime rate is moslty affected by the amount of people living in a certain area but we do not have the data to confirm this Hypotesis.
Summarizing the insights from the data, we conclude that it is advisable to avoid police districts Roxbury (B2), Dorchester (C11), and South End (D4), particularly around 5:00 PM. Generally, areas farther from the city center tend to be safer. While the data might initially suggest that Boston is a dangerous city, a closer analysis reveals otherwise. Considering that crime peaks at about 5 crimes per hour (mostly not violent) in a city with over 650,000 residents, Boston is not as unsafe as it might seem. It is neither the safest nor the most dangerous city in the world. We simply recommend exercising caution a bit in the afternoon, especially near the city center.
The possible next steps could be centered on the motivation over why those districts are the ones that have higher crime rates. Before we hypotised that this fact could be related with the demografic distribution of the city itself, but there are many other possible different reasons. The research is not really focussed on "why some places are better than others" but more on which ones are safer with respect to the others. Perhaps even asking directly the city of Boston, or others, if there are aspects they would prefer to have evaluated in order to draw conclusions to improve the safety of the city. The possibilities are many and very disparate from one another.